← Back to projects
Security engineering case study · v0.10.0
TraceHawk — evidence-first security log investigation
I built a downloadable, self-hosted SOC investigation workspace that turns bounded logs and lightweight telemetry into deterministic findings, explainable incidents, exact evidence, multi-source cases, MITRE ATT&CK context, analyst notes, and exportable reports.
The online Azure demo intentionally exposes only a stateless learning subset. The GitHub release contains the wider product: persistence, saved investigations, case import, live sources, local AI, settings, retention, backup, RBAC, audit events, and Markdown, HTML, or PDF reporting.
Live Azure Container Apps
Open source MIT License
Release v0.10.0 community edition
Scope Private workspace + public learning demo
01 · Project overview
From raw telemetry to auditable investigation
Security demos often stop at a list of alerts. I designed TraceHawk around the investigation chain: where an alert came from, which raw lines support it, why findings were correlated, what confidence can be justified, and what can be exported for review.
Problem
Raw Linux, cloud, container, Windows, Zeek, Suricata, and Docker logs are difficult to review consistently when parsing, detection, correlation, and evidence handling are spread across separate tools.
Design response
I combined bounded intake, confidence-ranked parsing, transparent YAML rules, explainable correlation, evidence integrity checks, case workspaces, reports, and operational proof into one reviewable system.
My role
I owned product direction, architecture decisions, security boundaries, acceptance criteria, test strategy, debugging, release decisions, Azure delivery, public export review, and documentation quality.
Who it is for
The current shape fits homelabs, security learning, small-team evaluation, and portfolio review. It is not positioned as a replacement for a production SIEM or a multi-tenant SOC platform.
02 · Complete downloadable product
What TraceHawk actually does after you download it
The GitHub repository builds a complete self-hosted investigation application, not just the anonymous Azure demo. The protected profile runs the React workspace and FastAPI API together, persists bounded investigation state in SQLite, and enables workflows that are intentionally removed from the public deployment.
Bring evidence in
Upload bounded log files, run eight sanitized samples, import multi-file Zeek and Suricata cases, watch approved host sources, or start the optional loopback syslog collector.
Normalize and detect
Route supported lines through confidence-ranked parsers, preserve parser provenance, execute 66 deterministic YAML rules, and attach exact evidence IDs and MITRE context.
Build an incident
Correlate related findings by declared sequence, entity, time, and cross-source evidence. Show every score component and rationale instead of returning a black-box risk number.
Investigate
Move between incidents, findings, raw lines, entities, MITRE techniques, case links, and timelines while preserving the deterministic relationship between each view.
Retain analyst work
Reopen saved analyses from SQLite, record attributed observations, decisions, follow-ups, or false-positive notes, and export state before a retention operation.
Explain and report
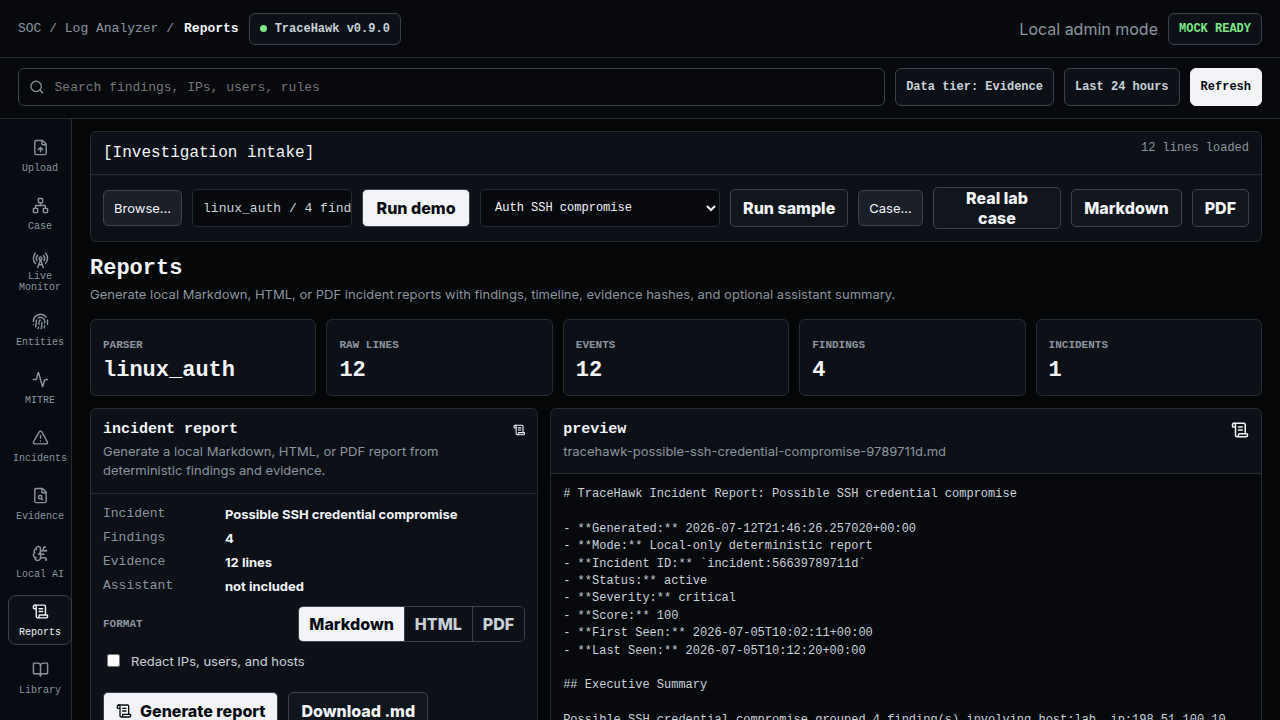
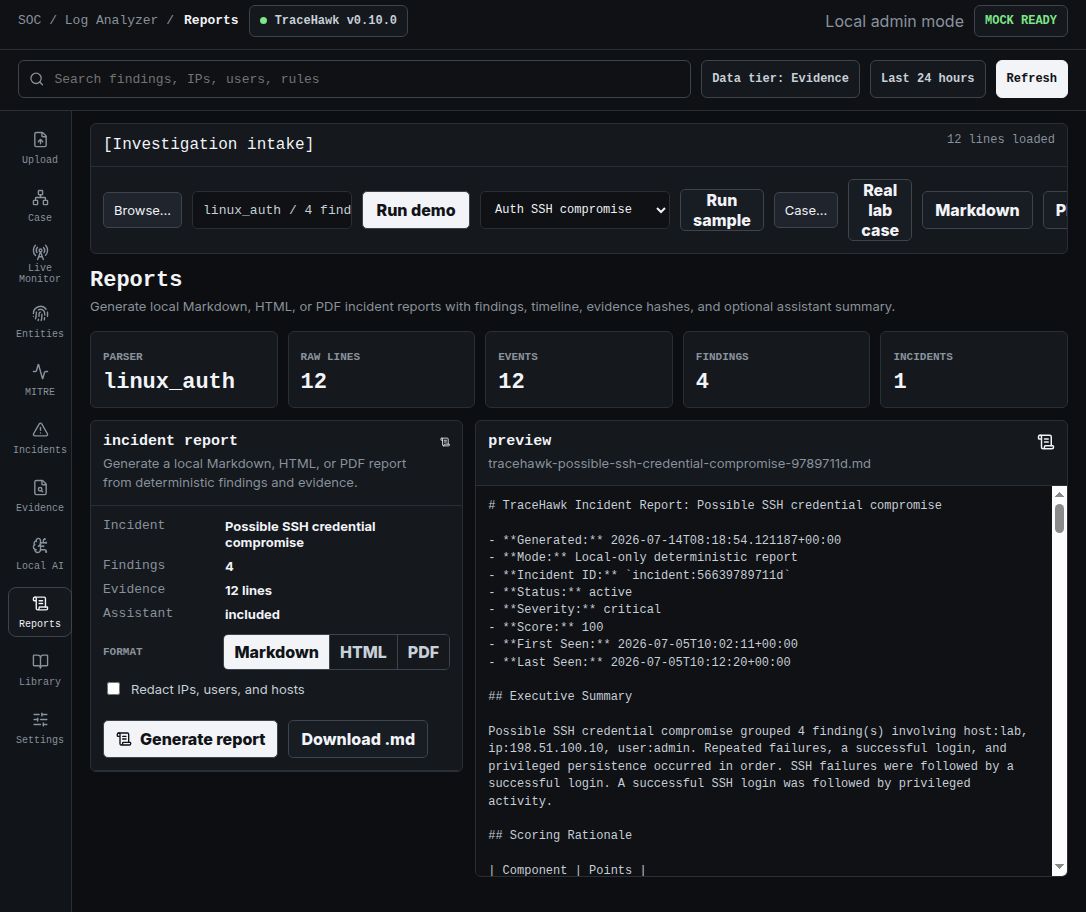
Generate redactable Markdown, HTML, or PDF incident reports, create multi-source case reports, and optionally include a bounded explanation from a local Ollama model.
Operate safely
Use role checks, audit events, request IDs, structured logs, health/readiness endpoints, metrics, online SQLite backup, schema migrations, and explicit retention preview/apply steps.
Extend and verify
Add versioned rules and scenarios, regenerate API contracts, run the full verification gate, and rebuild the same non-root Docker image used by the release workflow.
| Capability | Online public demo | Downloaded protected workspace |
|---|---|---|
| Purpose | Anonymous learning and bounded evaluation | Local investigation for homelabs and small teams |
| Workspace | Nine public analysis and tutorial surfaces | Eleven protected analyst and administration surfaces |
| Inputs | Three fixed samples and bounded session upload | Eight samples, file upload, case bundle, live sources, and optional syslog |
| Persistence | No database; browser and request memory only | SQLite runs, raw evidence, events, findings, incidents, entities, notes, settings, and audit records |
| Local AI | Disabled | Optional Ollama or deterministic mock with prompt preview and evidence bounds |
| Reports | Redactable Markdown only | Markdown, HTML, and PDF incidents; Markdown or PDF cases |
| Operations | Clear session and inactivity expiry | RBAC, audit, metrics, retention, export, backup, restore, and migrations |
Run locally
docker compose --profile production up --buildThe committed Compose profile binds the application to 127.0.0.1:8000. Local admin mode is appropriate only on a loopback-bound workstation; shared access requires a trusted identity-aware proxy and explicit role configuration.
03 · Investigation workflow
A case remains connected to its evidence
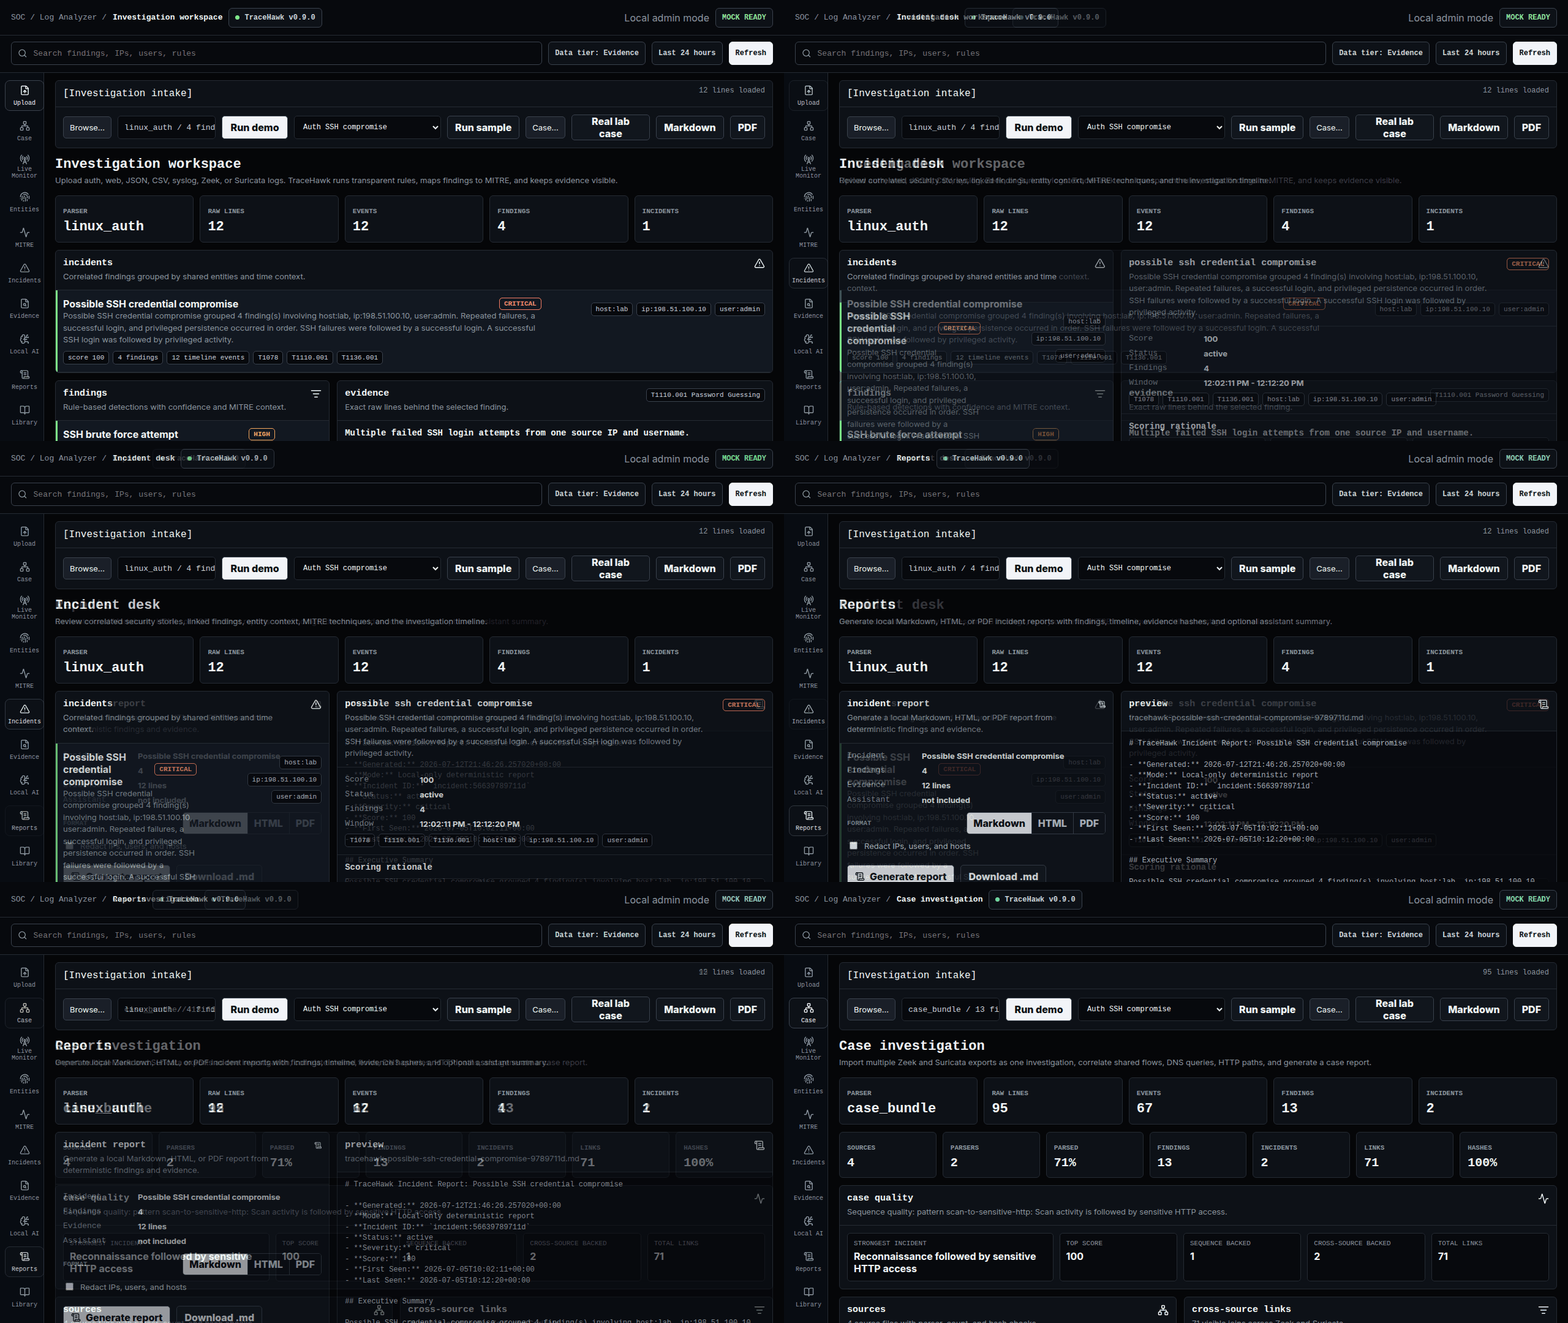
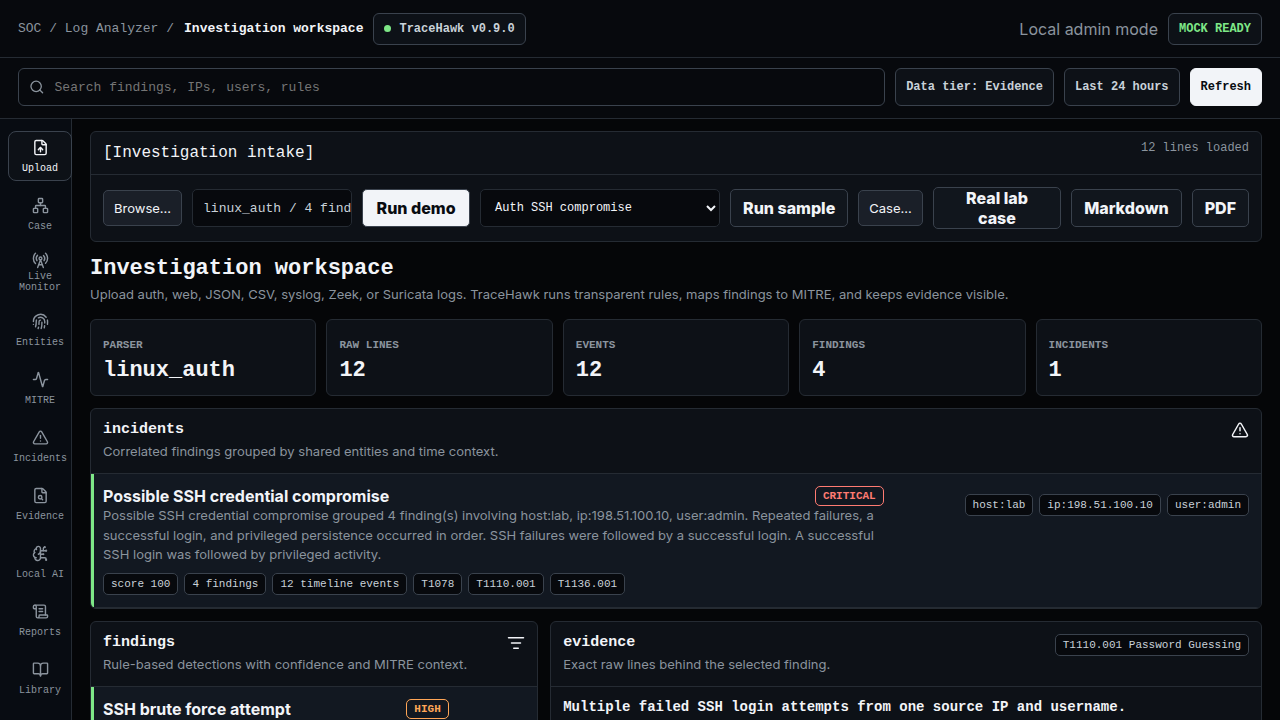
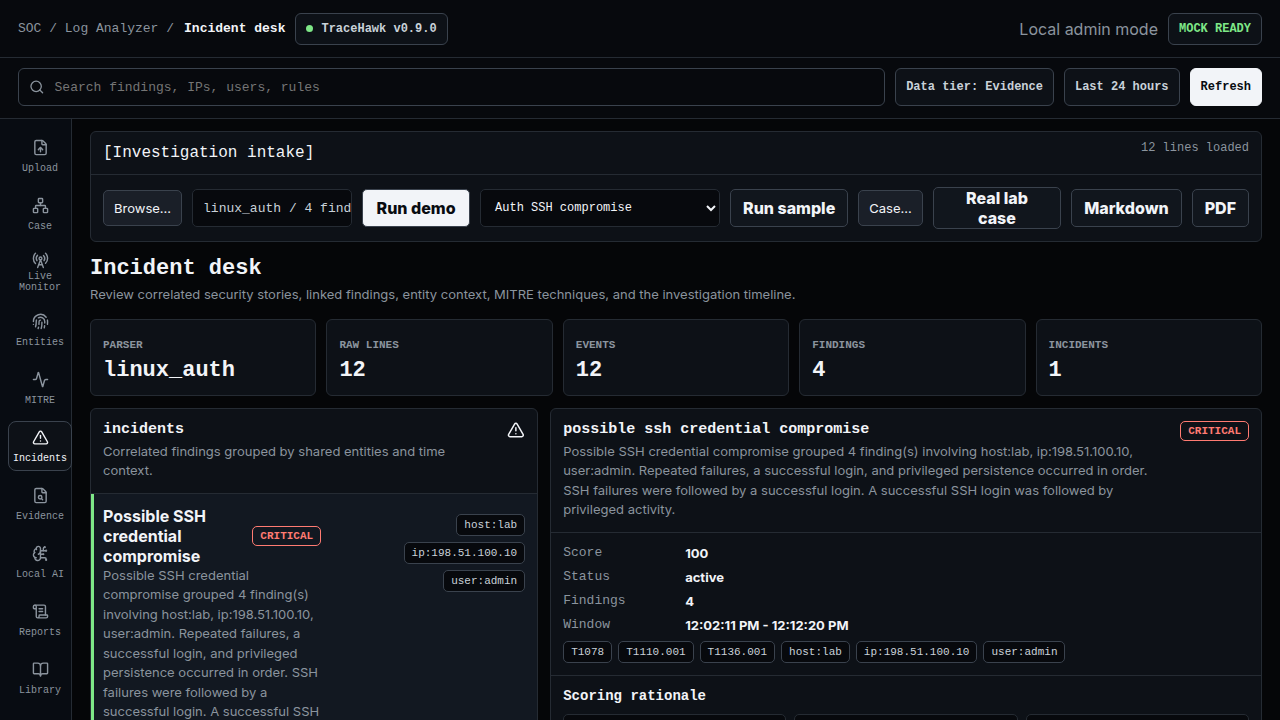
The interface is structured around a repeatable sequence: load bounded evidence, inspect deterministic findings, review correlation rationale, pivot through entities and raw lines, and produce a report.
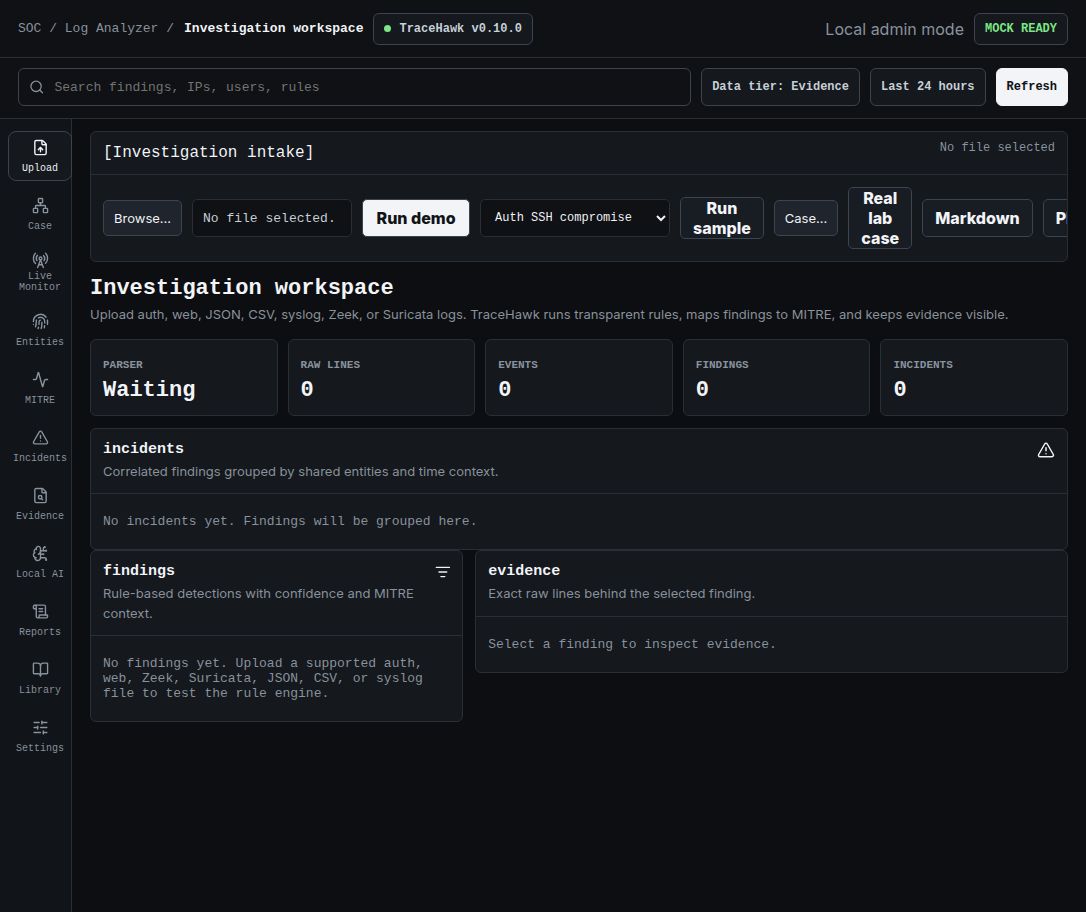
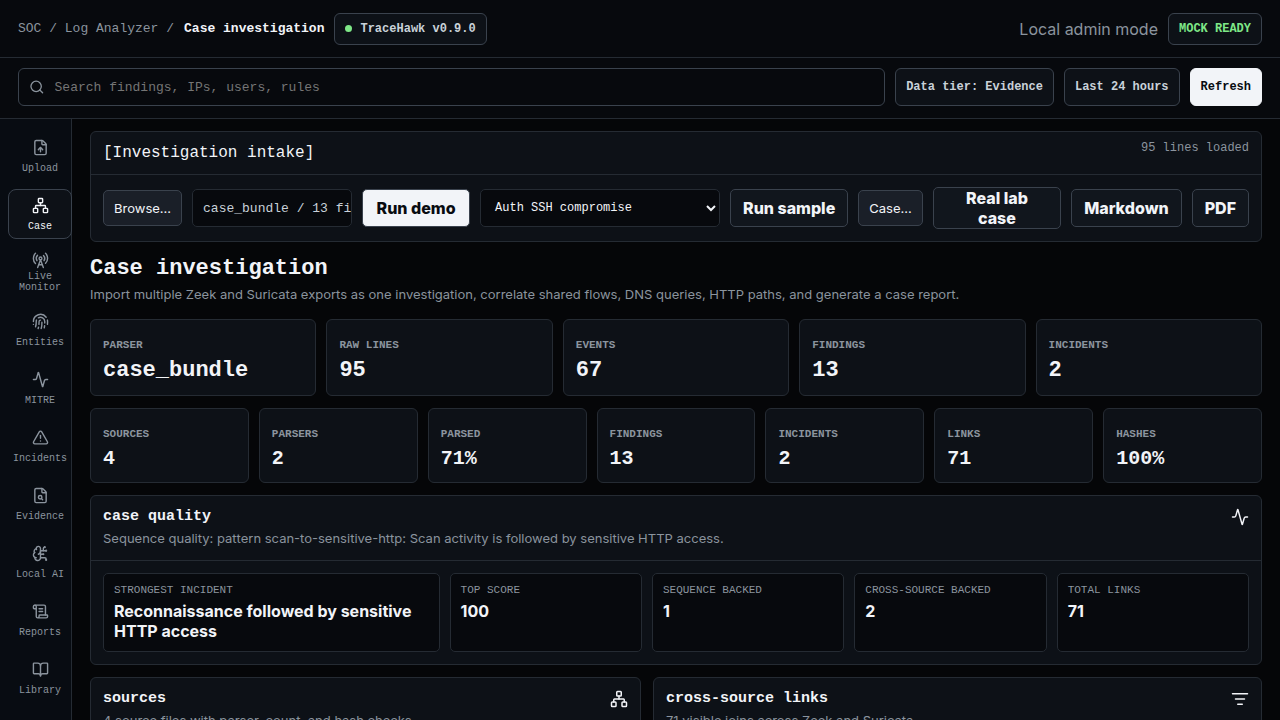
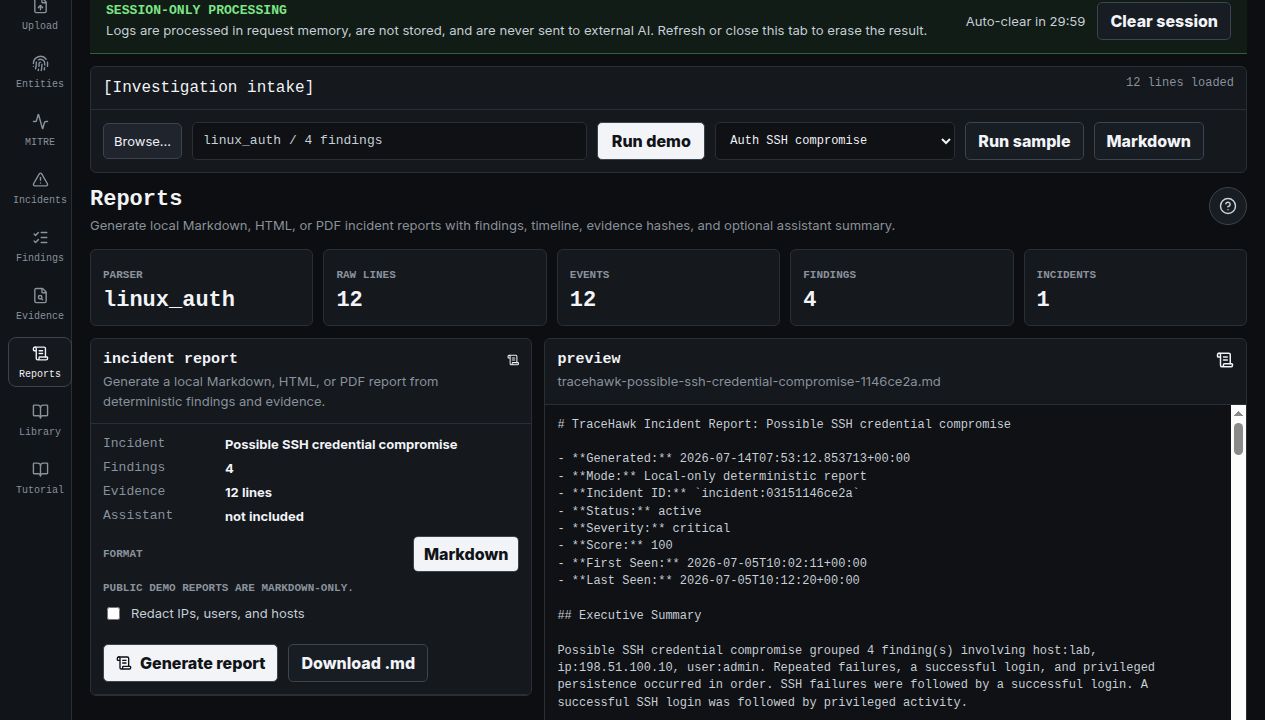
Media note: the first four captures and animated walkthrough preserve the v0.9.0 private-workspace interface. The public-demo captures below were recorded from the live v0.10.0 Azure deployment on 14 July 2026.
Bounded input→
Parsed events→
Findings→
Incidents→
Evidence→
Report
04 · Protected analyst workspace
One analysis state, eleven focused working surfaces
The full React application keeps the active analysis, selected incident and finding, assistant output, report format, live snapshot, rule selection, search query, and authentication state coordinated. Each view is a projection of the same evidence graph; the browser never invents findings locally.
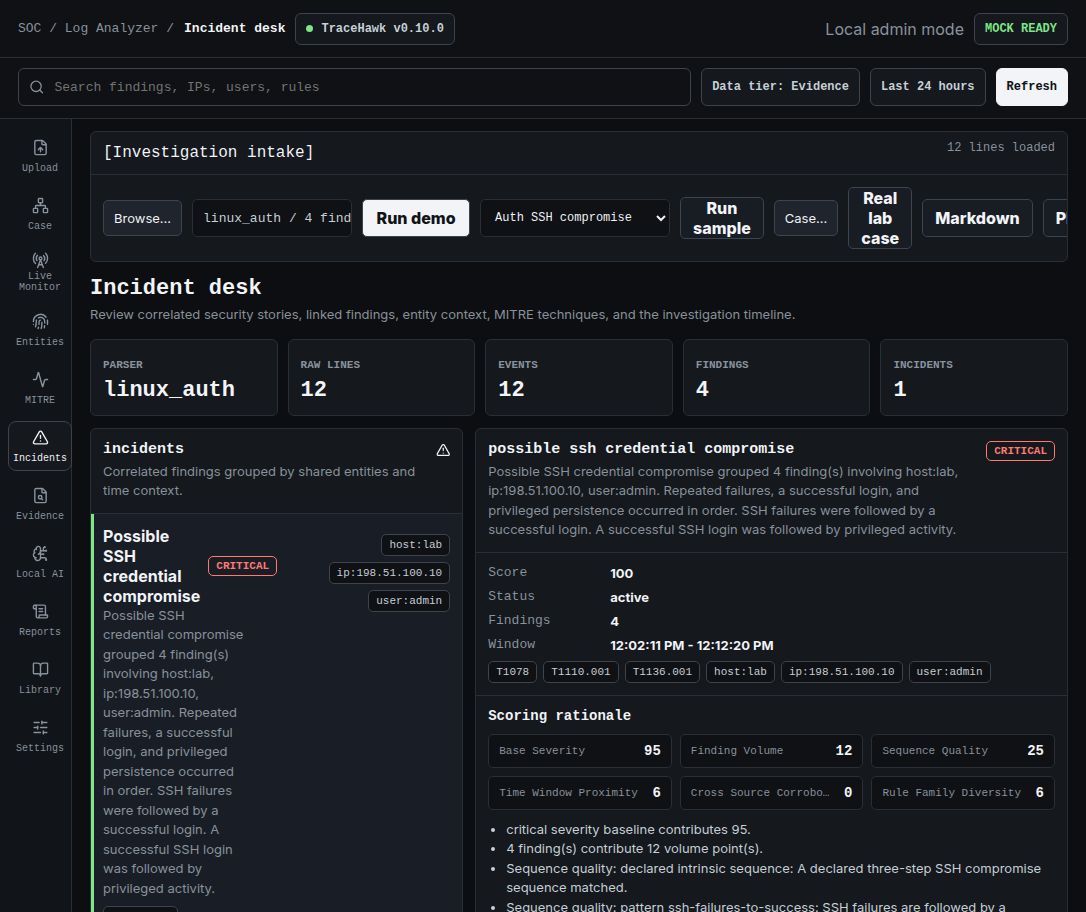
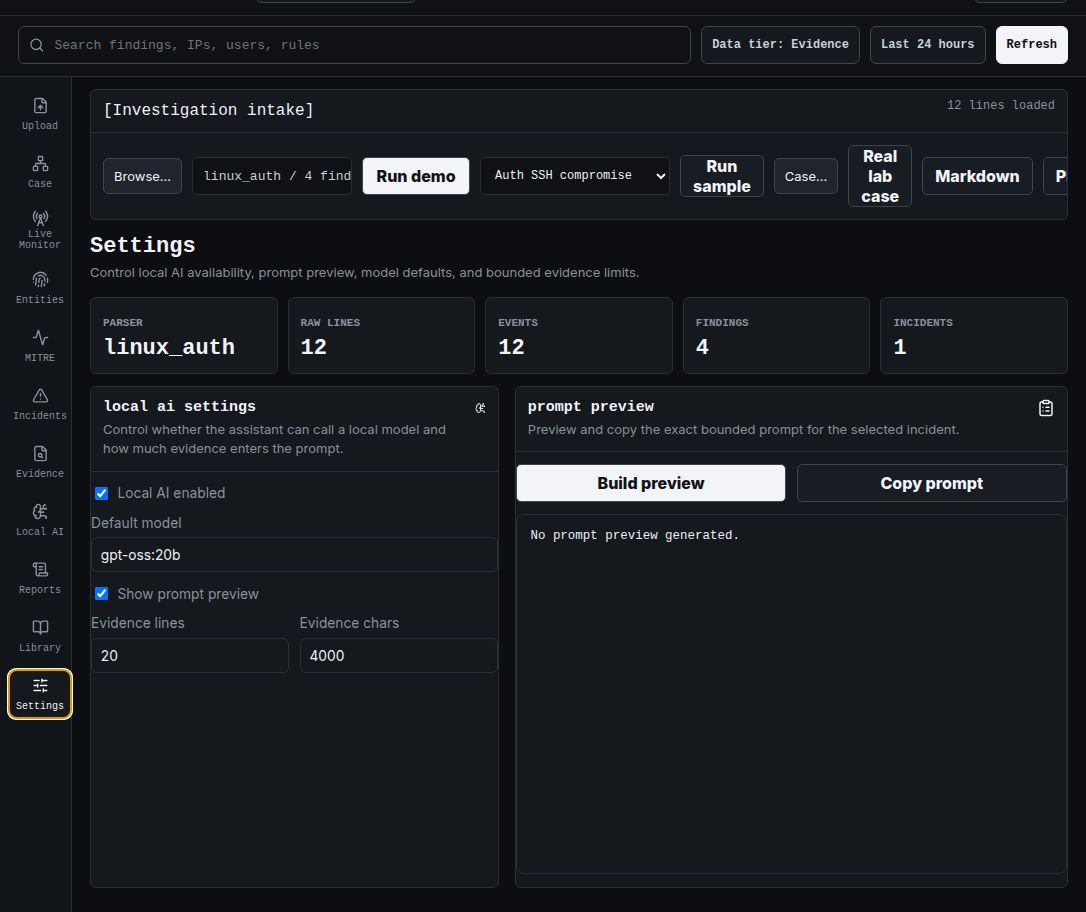
State boundary: the protected workspace can reopen persisted investigations and notes. The public demo cannot. The public browser result disappears on refresh, close, inactivity expiry, or Clear session.
05 · Public demo investigations
Three fixed samples expose different parser and detection paths
I ran every sample in the live public deployment and inspected the incident, finding, evidence, entity, MITRE, report, and search views. These are observed results from sanitized fixtures, not production accuracy benchmarks.
SSH credential compromise
12 raw lines produced 12 events, four findings, and one critical incident scored at 100.
- Brute force and success-after-failures detections.
- Privileged user-management activity.
- Visible scoring components, timeline, entities, and exact raw lines.
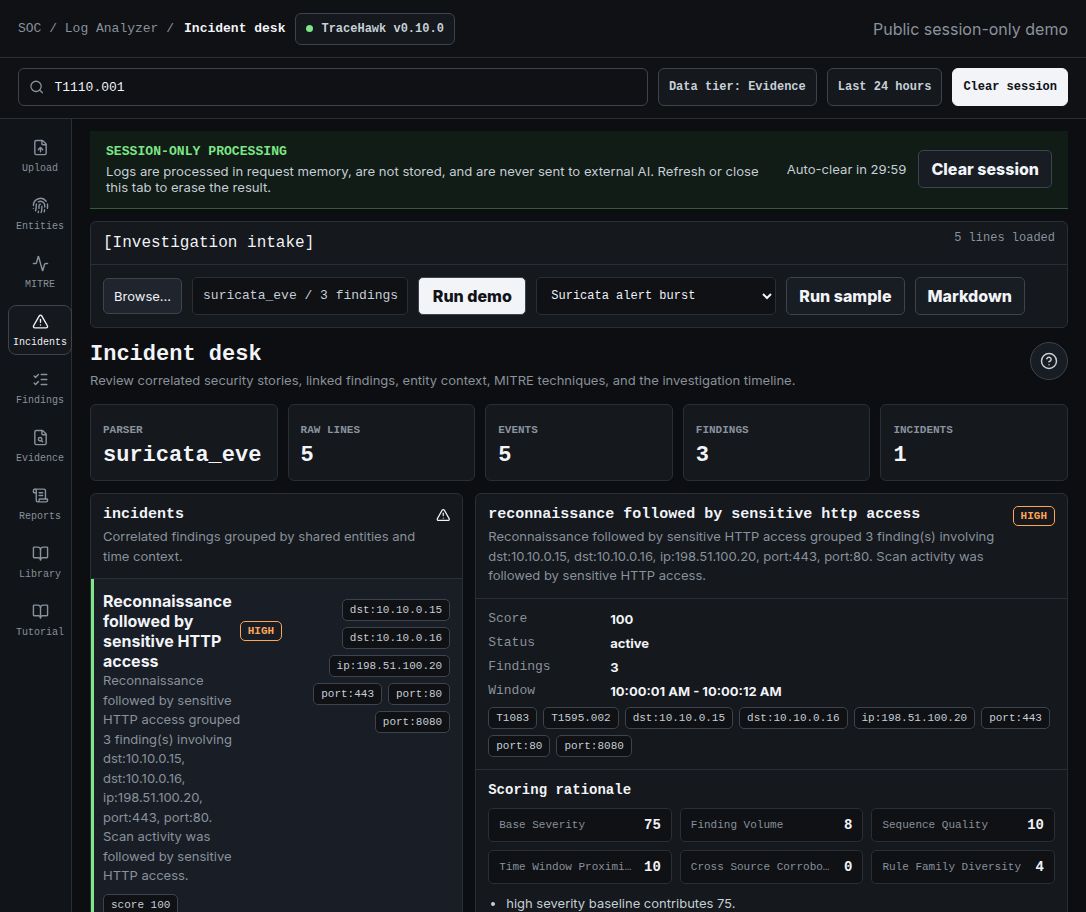
Suricata alert burst
Five raw records produced five events, three findings, and one critical incident scored at 100.
- Vendor-specific JSON outranks the generic JSON parser.
- Reconnaissance is correlated with sensitive HTTP access.
- Evidence remains linked to the resulting incident.
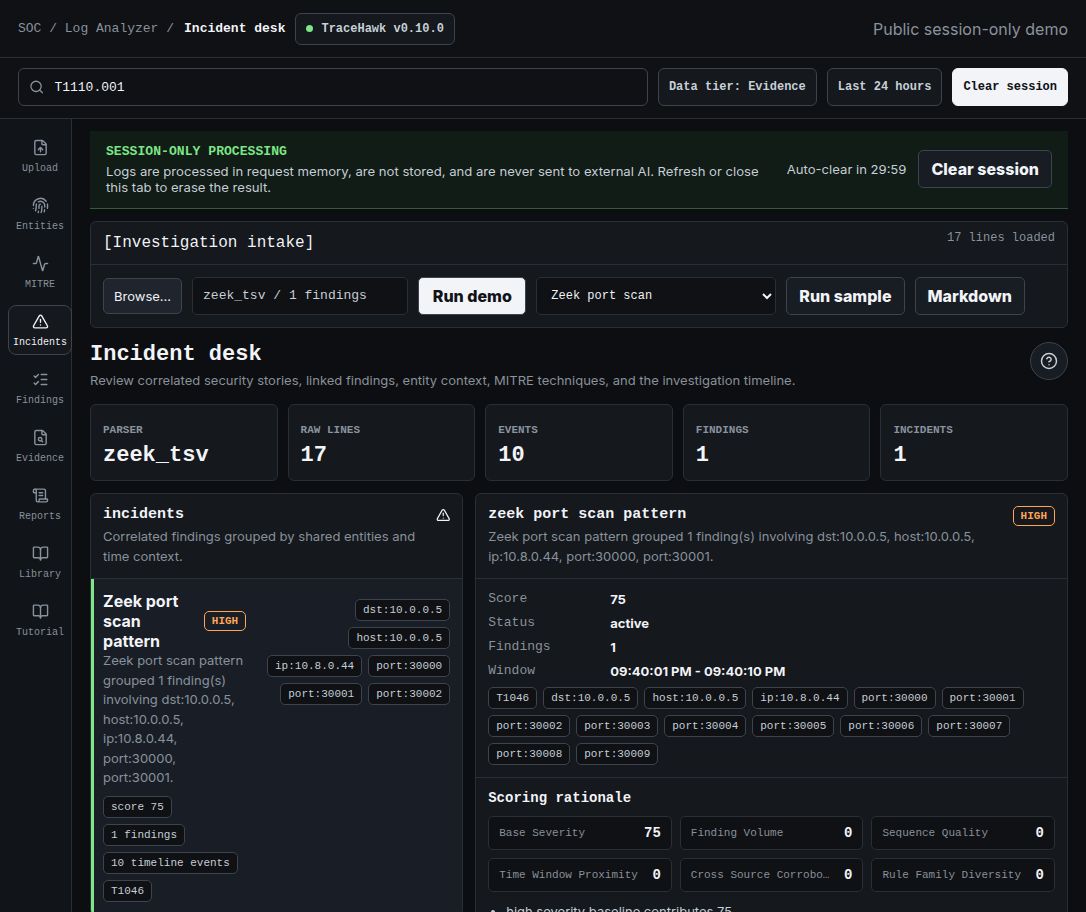
Zeek port scan
17 raw rows produced 10 normalized events, one finding, and one high-severity incident scored at 75.
- Zeek TSV headers and state are handled explicitly.
- A multi-port pattern is grouped into one explainable incident.
- Dropped and parsed counts stay visible to the reviewer.
06 · Public learning surfaces
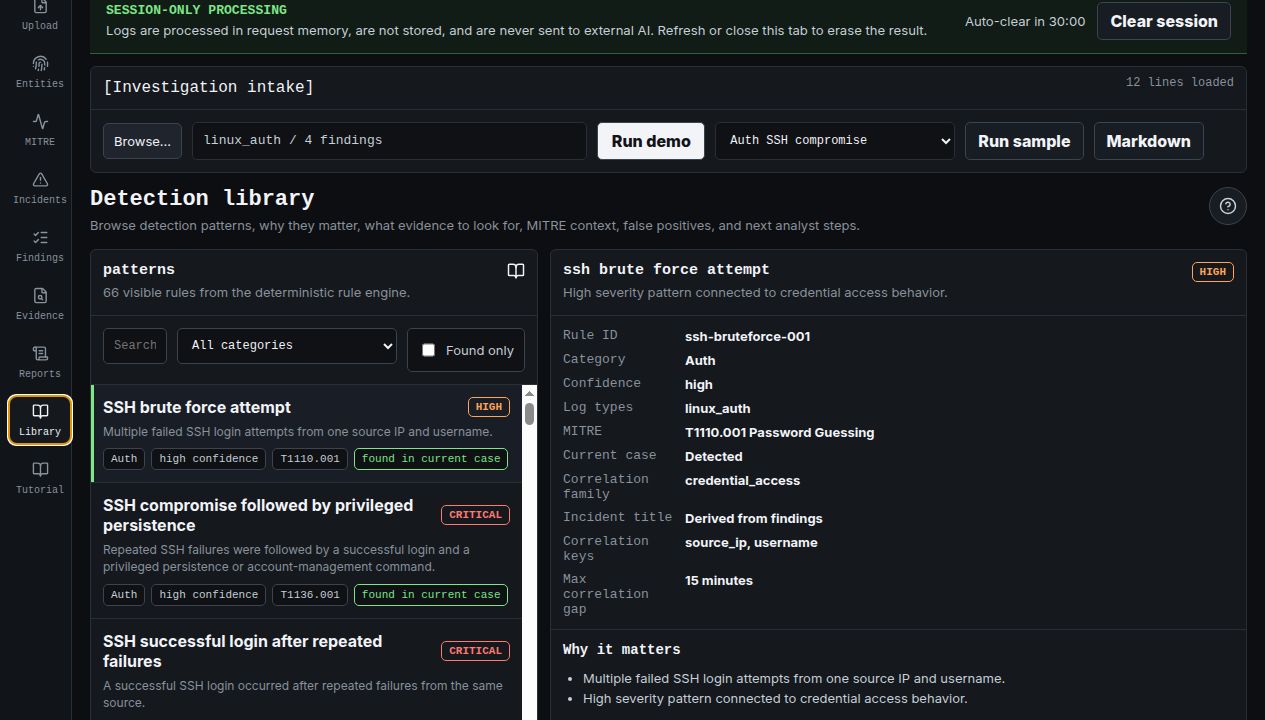
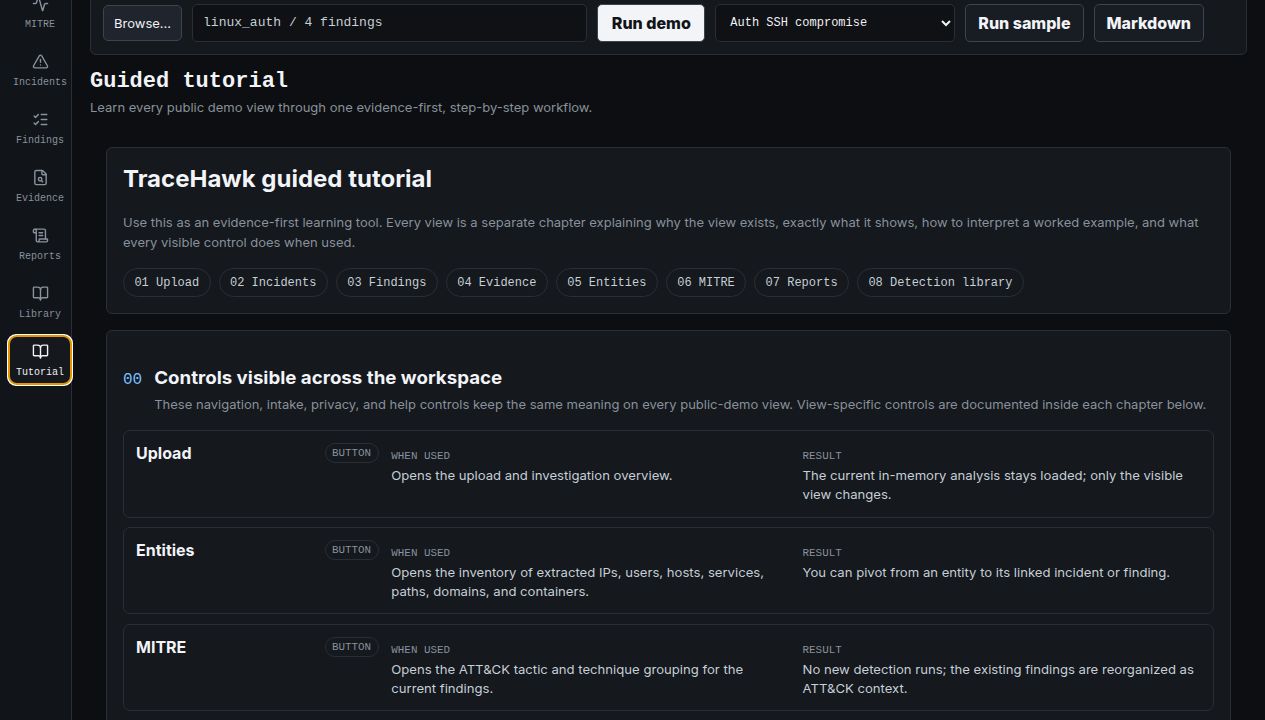
The public demo is more than an upload form
The v0.10.0 interface exposes nine connected surfaces. Global search can narrow the current analysis by technique, entity, rule, or evidence text without changing the underlying result.
07 · Architecture
Deterministic authority with an optional AI boundary
Findings are produced only by deterministic detection code. Optional local Ollama explanations receive a bounded projection of already selected evidence and cannot create, alter, or score findings.
InputUploads, samples, live sources
BoundaryRequest and resource limits
AnalysisParsers + 66 YAML rules
InvestigationCorrelation + entities
OutputEvidence + reports
Frontend
React, TypeScript, and Vite provide intake, investigation, evidence, entity, incident, report, tutorial, and operational views.
Backend
FastAPI, Pydantic, and SQLAlchemy enforce API contracts, authorization modes, resource limits, analysis orchestration, and persistence.
Detection content
Versioned YAML rules and correlation patterns keep detection logic inspectable, testable, and independent from titles or hard-coded rule identifiers.
Operations
Docker, Azure Container Apps, structured logs, metrics, health checks, backup and restore procedures, CI gates, and exact-commit verification support delivery.
Core invariant: AI is outside the detection authority. Raw input, parser provenance, rules, evidence IDs, MITRE mappings, correlation, and incident scores are deterministic. A local Ollama model can only explain a bounded projection after those results exist.
08 · Ingest and parser routing
Specific security formats outrank generic fallbacks
TraceHawk does not infer a parser from a filename or first line alone. It samples non-empty input across the file, ranks parser specificity, suppresses weak generic matches, supports mixed inputs, and preserves _tracehawk_parser provenance on normalized events.
| Input family | Parser behavior | Investigation value |
|---|---|---|
| Linux auth and syslog | Recognizes authentication, sudo, account, and generic syslog structures | Credential activity, privilege changes, service and host context |
| Web access | Normalizes request, status, client, method, path, and response patterns | Scanning, sensitive paths, error bursts, and suspicious access |
| CloudTrail and Kubernetes audit | Specific JSON parsers outrank generic JSON records | Cloud identity, control-plane, and administrative actions |
| Windows Security | Maps supported security-event fields into the shared event model | Authentication and privileged Windows activity |
| Zeek and Suricata | Handles Zeek TSV/JSON state and Suricata EVE records explicitly | Network scans, alerts, connections, DNS, and HTTP corroboration |
| CSV, JSON, packet metadata, Docker | Bounded generic and live-source adapters feed the same pipeline | Portable lab ingestion without claiming a complete connector ecosystem |
09 · Multi-source cases and live inputs
The downloaded application can investigate more than static uploads
The protected profile supports two wider workflows: combining exported telemetry from multiple engines into one case, and observing bounded local sources through WebSockets or the optional syslog collector. Both paths reuse the same parsing, rules, correlation, evidence-integrity, and persistence services.
Zeek + Suricata case investigation
The case endpoint accepts up to eight files and eight megabytes by default. Each source keeps its filename, parser, raw-line count, event count, finding count, and SHA-256.
- Links matching HTTP paths, DNS queries, or network flows within bounded time windows.
- Preserves both engine event IDs and both raw-line IDs for every cross-source link.
- Builds source filters, case metrics, a combined event/link timeline, and case-quality indicators.
- Produces a report grouped by source with hashes, correlation method, findings, incidents, and evidence.
Bounded live monitoring
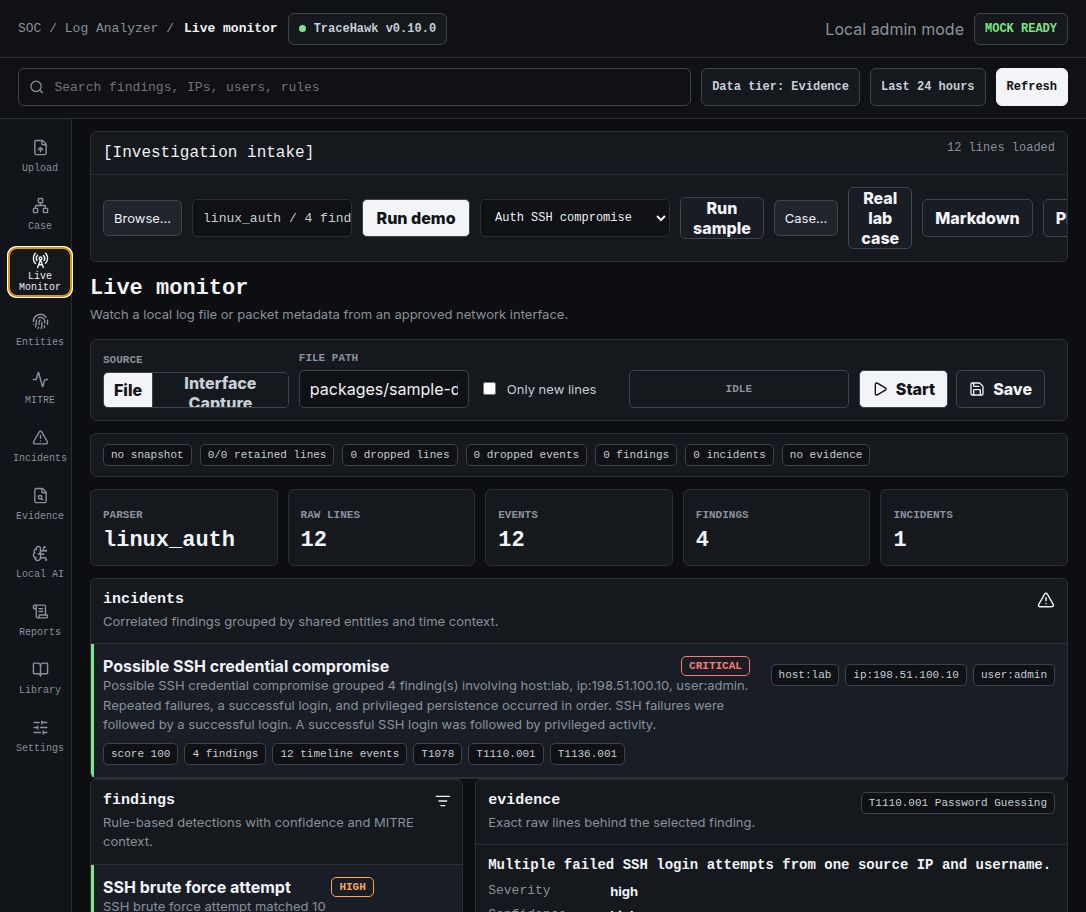
Admin-only WebSocket routes can observe an approved file, folder, Docker container, or packet-metadata interface. Viewing is transient; saving a snapshot is a separate explicit operation.
- Pause and resume controls separate connection state from source state.
- Rolling raw-line and event budgets expose retained and dropped counters.
- The backend signs emitted snapshots with a process-local HMAC before persistence.
- Saved snapshots are independently rehashed and graph-validated before SQLite commit.
| Source | How it enters | Important boundary |
|---|---|---|
| Uploaded files | HTTP file or multi-file case input | 2 MB / 100,000 lines per normal upload; allowlisted extensions |
| File tail | Admin WebSocket selects a host path | Can start at end; rolling snapshot is not durable until Save |
| Folder watch | Admin WebSocket follows approved folder activity | Host-resource selection remains an admin capability |
| Docker logs | Admin WebSocket follows container stdout/stderr | No claim of distributed container collection |
| Interface capture | Bounded tshark field output | Metadata only by default; owned or explicitly authorized interfaces |
| Syslog TCP/UDP | Optional Compose collector on loopback port 5514 | 8,192-byte lines, 1,000-line queue, 32 TCP connections, visible loss counters |
4sources
67events
13findings
2incidents
71cross-source links
The repository documents these as the expected result of its committed real-lab Zeek/Suricata case contract. They are fixture results, not production traffic metrics.
Current community-export defect found during this review: the v0.10.0 image contains the Real lab case action, but its referenced proof-pack files are not included in the public export, so that convenience action returns “Real lab proof pack was not found.” Manual case upload and the case-bundle API remain implemented and tested; the shortcut should be repaired in the next release.
10 · Security boundaries and authorization
The public demo and protected workspace have different trust contracts
I do not expose the protected analyst workspace as the public portfolio demo. The anonymous deployment removes persistence and privileged capabilities. The downloaded application can run loopback-only with local admin access or behind a trusted Azure Easy Auth-compatible identity proxy with viewer, analyst, and admin roles.
Anonymous public-demo contract
| Boundary | Public demo behavior | Reason |
|---|---|---|
| Persistence | Database and server-side session storage disabled | Visitor evidence must not become retained analyst state. |
| AI | External AI disabled | Uploaded content must not be forwarded to a model provider. |
| Private APIs | Private routes return 404 | The public surface exposes only the bounded demo contract. |
| Input | 512 KiB, 20,000 lines, 10-second analysis timeout | Anonymous work remains resource bounded. |
| Abuse control | Five requests per 600 seconds, concurrency two, 30-minute browser inactivity clear | The current process-local controls require a single replica. |
| Content | Fixed sanitized samples and session-only visitor analysis | Production logs and confidential evidence are out of scope. |
Safe use: do not upload credentials, client data, private topology, production logs, internal hostnames, or real incident evidence to the public demo.
Protected workspace role model
| Capability | Viewer | Analyst | Admin |
|---|---|---|---|
| View runs, incidents, entities, rules, MITRE, notes, status, and settings | Yes | Yes | Yes |
| Start upload, sample, or case analysis | No | Yes | Yes |
| Generate reports and assistant prompt previews | No | Yes | Yes |
| Create, update, or delete analyst notes | No | Yes | Yes |
| Preview retention | No | Yes | Yes |
| Select host file, folder, Docker, or interface live sources | No | No | Yes |
| Change settings, apply retention, read audit trail, create backup | No | No | Yes |
Loopback local mode
TRACEHAWK_AUTH_MODE=disabled maps the local user to admin but the committed Compose profile binds only to 127.0.0.1. Identity headers are ignored.
Identity-proxy mode
azure_easy_auth accepts a principal only behind a trusted header-sanitizing proxy and fails startup without an email allowlist. Unbound allowlisted users receive viewer access.
Audit trail
Mutations, denied access, and live WebSocket attempts store actor, role, path, outcome, status, timestamp, and request ID without copying bodies, credentials, reports, or uploaded evidence.
Remaining boundary
The audit trail, rate limiter, metrics, and SQLite writes are instance-local. Multi-replica operation requires external shared state and an immutable centralized audit sink.
11 · Persistence, retention, and operations
Saved evidence has an explicit lifecycle
The downloaded application does not retain the original uploaded file, but it does persist the raw line text needed to reopen evidence and explain saved findings. That distinction matters: local-first does not mean non-sensitive, and report redaction does not alter stored evidence.
AnalyzeBounded input in memory
→
ValidateHashes, IDs, counters, graph
→
PersistAtomic SQLite transaction
→
UseReopen, note, report, export
→
RetirePreview, purge, or delete
Persisted investigation graph
Analysis runs own log sources, raw lines, normalized events, findings, incidents, entities, and analyst notes. Settings and audit events exist outside a single analysis.
Evidence integrity
Before commit, the backend recomputes every unpurged SHA-256 and validates counts, unique IDs, source ownership, event-to-line links, finding evidence, incident membership, and case links.
Analyst notes
Analysts can attach observations, decisions, follow-ups, or false-positive calls to an incident. Protected mode attributes notes to the server-side authenticated identity.
Retention
A preview lists affected analyses before apply. Policy can remove a complete analysis or replace raw text with [PURGED_RAW_LOG] while retaining the original one-way hash.
Backup and restore
The API and CLI use SQLite online backup plus integrity checks instead of copying a live database blindly. Restore is an explicit offline operator procedure.
Schema migrations
Alembic upgrades the database to head at startup, recognizes documented earlier schemas, and rejects partial unknown unversioned schemas rather than guessing.
Health and metrics
Liveness, readiness, structured JSON logs, request IDs, latency, in-flight requests, build metadata, and collector counters expose runtime state without logging evidence bodies.
Failure semantics
A rejected replacement leaves the last committed analysis intact. Purged evidence cannot be recovered from hashes, and insecure backups expose the same sensitive data as the live database.
12 · Repository and release evidence
The public repository is part of the case study
The GitHub release is not a source dump without context. It is a curated MIT-licensed community export with runnable code, tests, documentation, sanitized proof assets, dependency manifests, and an export receipt tied to a clean source state.
Curated public files
PUBLIC_EXPORT.json records release v0.10.0, source commit, file count, content digest, allowlist policy, and clean export state.
Versioned rules
YAML content spans authentication, cloud, Kubernetes, Windows, web, network, Zeek, Suricata, syslog, CSV, and JSON families.
Scenario contracts
Each scenario separates input, expected output, and explanation so regression evidence remains inspectable.
CycloneDX SBOMs
The v0.10.0 release publishes Python and web dependency inventories alongside evaluation and report samples.
- Generated OpenAPI and TypeScript contracts fail the build when backend and frontend schemas drift.
- GitHub Actions covers tests, builds, dependency audits, Gitleaks, Semgrep, container scanning, scenario contracts, and public-demo verification.
- Architecture decisions document parser routing, evidence identity, deterministic correlation, and the local-LLM boundary.
- Release assets include the export receipt, current IoT-23 evaluation, SBOMs, demo media, and sample incident reports.
13 · Verification evidence
Claims are tied to executable gates
The figures below reflect the current v0.10.0 verification baseline. They are evidence of tested behavior, not a claim of production-scale SOC readiness.
Backend tests
89.11% measured coverage across API, parsing, detection, correlation, evidence, reports, authorization, and operations paths.
Frontend tests
74.4% statement coverage and 62.19% branch coverage across critical investigation interactions.
Browser workflows
Five private-workspace and two public-demo end-to-end Chromium paths.
Security scan findings
No known pip/npm dependency vulnerabilities, no Gitleaks secrets, and no Semgrep findings in the verified gate.
- All 66 rules have positive contracts; committed scenarios reported no unexpected or missing findings.
- The live Azure verifier confirmed database-disabled public mode, external AI disabled, private API denial, and eight tutorial chapters.
- CI also covers container build, dependency audits, secret scanning, static analysis, browser workflows, and public exact-commit verification.
- The complete gate is reproducible from the source repository with
make verify-all.
14 · Detection quality
External data exposes weaknesses that fixtures cannot
I evaluated selected rule families against role-separated IoT-23 captures. The results are intentionally published with false positives and false negatives because a security project is not credible if only successful fixtures are shown.
| Rule family | Windows | TP / FP / FN / TN | Precision | Recall |
|---|---|---|---|---|
| Network scan | 880 | 1 / 1 / 1 / 877 | 50.0% | 50.0% |
| Command-and-control indicator | 270 | 2 / 21 / 1 / 246 | 8.7% | 66.7% |
Interpretation: the C2 indicator is too noisy for production authority in its current form. The evaluation proves the measurement process and identifies tuning work; it does not prove mature detection accuracy.
15 · Runtime AI boundary and development disclosure
AI can explain evidence; it cannot become detection authority
TraceHawk has two distinct AI stories. Inside the product, optional local AI explains an already-created deterministic incident. During development, generative AI produced most implementation drafts. Both boundaries are public and independently limited.
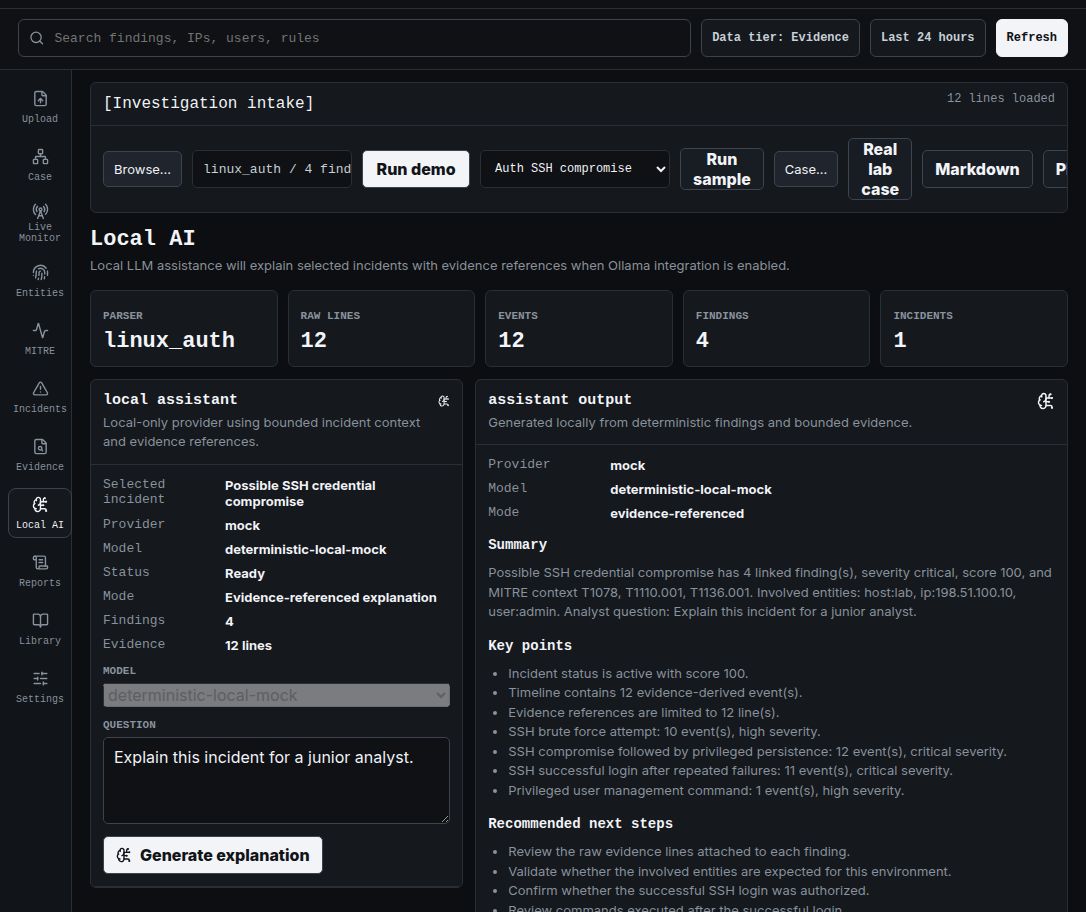
Evidence-bounded local assistant
- Supports
ollama, deterministicmock, anddisabledmodes. - Sends only selected incident context, linked findings, and bounded evidence lines.
- Separates instructions from untrusted log text and exposes the exact prompt preview.
- Schema-validates output and removes evidence references absent from the prompt.
- Returns summary, key points, next steps, evidence references, and guardrails.
- Cannot create, remove, promote, rescore, or modify a deterministic finding.
Analyst communication
- Incident reports support Markdown, HTML, and PDF.
- Case reports combine source hashes, cross-source methods, incidents, and evidence.
- Redaction can mask IPs, users, and hosts without modifying stored evidence.
- Reports separate observed evidence, interpretation, and recommended next action.
- A local assistant summary is optional and visibly marked when included.
How the implementation was produced
I estimate that approximately 99% of the implementation code was initially generated or drafted with generative AI assistance. I do not present that code volume as proof of personal authorship by manual typing.
What AI accelerated
- Initial implementation drafts and repetitive code paths.
- Test scaffolding, documentation drafts, and review prompts.
- Alternative implementation ideas and rapid iteration.
What remains my responsibility
- Problem selection, product direction, scope, and architecture decisions.
- Security boundaries, test expectations, debugging, and acceptance.
- Understanding tradeoffs, rejecting unsafe output, releases, and public claims.
The evidence standard: a certificate can support the claim that I understand principles, while a project demonstrates application. Tests, architecture explanations, limitations, and an explicit AI-use record make it possible to evaluate what I actually learned and can defend.
Complete prompt histories were not retained, so the estimated generated-code share is disclosed but is not independently auditable line by line.
16 · Certification context
Certification and project evidence reinforce each other
I completed Microsoft Certified: Azure Fundamentals (AZ-900). TraceHawk adds practical evidence around Azure delivery, deployment boundaries, containerized services, security controls, CI validation, and operational ownership.
This Microsoft Learn link includes my Microsoft Student Ambassadors Contributor ID. The portfolio, demo, and GitHub links do not use Microsoft tracking parameters because they are not Microsoft Learn destinations.
17 · Limits and next steps
Current boundaries are explicit
Not yet claimed
- Multi-tenant isolation or horizontally scaled operation.
- A distributed log store or collector fleet.
- A centralized rate limiter or immutable external audit sink.
- Automated response, production SIEM replacement, or certified detection coverage.
- Independent production adoption, SOC history, or population-level accuracy.
- Exhaustive cross-browser, responsive-device, or screen-reader validation.
Engineering direction
- Tune noisy rule families against external datasets.
- Expand negative controls and cross-source evaluation.
- Keep public/private deployment contracts independently verifiable.
- Restore the omitted public real-lab fixture or remove the broken convenience action.
- Improve operational evidence without overstating scale readiness.
Review the working system